
Boost your SQL query without even running it
I had a SQL query to optimize that was heavily relying on the TEMP tablespace due to multiple HASH JOINs and aggregations. The session quickly exhausted its allotted PGA memory, pushing the joins to disk after just a few seconds. Since this query was used for large-scale data extraction, it originally took around 30 hours to process one month’s worth data.
Considering that the query was to run across several years data located in monthly partitions, I was looking at several months in total of elapsed time spent on execution of all these extraction queries. That was unacceptable.
Even worse: after applying standard optimizations I reached the point where there wasn’t much left to tune. At this stage I had to face it: any further tuning had to rely on hardware-based optimizations as a potential solution.
Given that “direct path read temp” was the dominant wait event, and I was working on the Exadata system I considered moving the TEMP tablespace to Flash Disks.
The Exadata was rather old version, I guess X4 and the version of the Exadata may be important considering utilizing the Flash Cache directly for the purpose of holding the temp chunks – see the end of this post under “Update 14.10.2024“.
I obviously expected that this approach would improve the overall performance of the entire data extraction process, but the key question was: by how much?
I needed to estimate the time savings fairly accurately since this series of queries was to be executed hundreds of times over the course of the next several months and there was a strict deadline over me.
This turned out to be the challenge, and here’s how I approached it.
Note.
I encourage you to keep reading even if you do not utilize Exadata Appliance, as this post is not just about “moving the TEMP tablespace to Flash”.
Solution of the problem in summary
– First, I profiled the query’s wait events using 30 hours worth data from Active Session History (the total runtime of the query).
– Then, in order to estimate the potential performance improvement for the component which I possibly could optimize (“accessing the TEMP tablespace”), I ran the query for just a short period (~2 minutes), awaiting the moment in which the HASH JOIN phase (creating Hash-Table) began spilling to disk – to the TEMP tablespace.
– Using SQL Monitor I had precisely identified this moment of time and right afterwards I have initiated 10046 tracing. I let the trace to gather data for just several minutes, capturing it for later processing and analysis (profiling).
Then I have stopped the execution of the query – there was no need to keep it for longer time, I already had what I required.
So, basically, from the obtained raw 10046 trace file I calculated the average latency of the “direct path read temp” wait while having the TEMP tablespace on HDD.
– Now the core phase: I have moved the TEMP tablespace to Flash Disks and repeated the above process, so I kept the query running for a very short period of time with HASH JOIN and the 10046 trace in the background.
This time I obviously measured the latency of “direct path read temp” with the TEMP tablespace on Flash Disks.
– With these two figures at hand I was able to calculate the expected performance improvement for the entire 30-hour query.
So I had all the necessary data for further calculations, including:
- The total time lost during access to “TEMP on HDD” (from ASH)
- The average latency for “TEMP on HDD” (from the raw 10046 trace file)
- The average latency for “TEMP on Flash Disks” (from another raw 10046 trace file)
Pictorially, I could describe the above steps with this diagram :
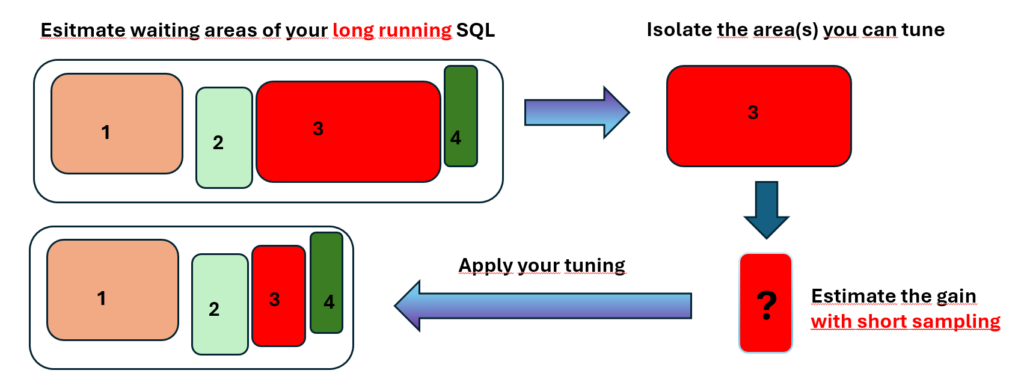
It’s worth mentioning that for the 30-hour query, by isolating the boostable area and conducting a short yet representative sampling using a 10046 trace, it only took about 45 minutes to estimate the potential performance gain of the entire 30hrs query (whereas creating of the TEMP on Flash Disks took half of that time).
The below test scenario is obviously the simulation of my problem as I am not allowed to reveal the true SQL nor the relevant data. It’s fairly representative though and emphasizes the crucial areas which adheres to the real case.
First, it’s important to note that this approach with Temp on Flash Disks can be best described as “horses for courses” principle as there are trade-offs involved.
For example, this strategy can possibly be better suited for DWH-type of data processing which typically tends to be TEMP-intensive. DWH queries often involve large joins and aggregations that eventually often spill over to TEMP tablespaces.
If, for example, 80% of the query’s time is spent on those TEMP-related heavy operations, you might see up to a 20x improvement – but just in this area.
The remaining 20% of the query execution might not be boosted at all or could even run slightly slower, since e.g. full table scans might no longer fully benefit from Flash Cache, given that a portion of it would be reallocated for the ASM disk group used by TEMP.
Additionally, there’s a key downside when creating an ASM disk group on Exadata (to host the TEMP tablespace). Namely, we lose at least 50% of the dedicated flash storage, as at least the NORMAL redundancy is required for the disk group.
Perhaps worth mentioning – you are not limited to Exadata in order to utilize Flash Disks for the purpose of TEMP (or any other purpose). Such disks can be installed into a PCI slot in your server. I won’t enhance this topic though.
As mentioned, the following test is based on artificial data, yet the steps and proportions adhere to the true case.
I need to emphasize it though: this post is definitely not just about presenting of how to move the TEMP tablespace on Flash Disks on Exadata.
It’s much more about the method of estimating of the time gain of the boostable area(s) of your long running query by short sampling of this/these targeted part(s).
Therefore, I will skip the detailed description of the tasks related to creation of TEMP tablespace on Flash Disks and will simply attach the commands which I have used.
They comprise :
- Drop the flash cache
- Create the grid disks based on Flash
- Create the ASM diskgroup based on Flash, then eventually create the TEMP tablespace on that diskgroup.
Commands which enabled me to create TEMP tablespace on Flash Disks on Exadata:
dcli  -g cell_group -l celladmin “cellcli -e ALTER FLASHCACHE ALL FLUSH NOWAIT”
dcli  -g cell_group -l celladmin “cellcli -e LIST CELLDISK ATTRIBUTES name, flushstatus, flusherror” | grep FD

while true; do dcli  -g cell_group -l celladmin “cellcli -e LIST CELLDISK ATTRIBUTES name, flushstatus, flusherror” | grep FD ; echo “————————————“; sleep 5; done

for cell in $(cat cell_group) ; do dcli -c $cell -l celladmin “cellcli -e list flashcache detail”; done
dcli  -g cell_group -l celladmin “cellcli -e drop flashcache”
dcli  -g cell_group -l celladmin “cellcli -e create flashcache all size=2048g”    -->     I still left some flashcache

dcli  -g cell_group -l celladmin “cellcli -e  list flashcache attributes all”
dcli  -g cell_group -l celladmin “cellcli -e  create griddisk all flashdisk prefix=flashd”
dcli  -g cell_group -l celladmin “cellcli -e  list griddisk attributes all where diskType = ‘FlashDisk’ “
cat /tmp/crdg.sql

create diskgroup FLASH_DG normal redundancy disk 'o/*/flashd*'
      attribute 'compatible.rdbms'='11.2.0.0.0',
      'compatible.asm'='19.10.0.0.0',
      'cell.smart_scan_capable'='TRUE',
      'au_size'='4M';


19:41:48 SYS @ +ASM1> @/tmp/crdg.sql

Diskgroup created.


19:47:24 SYS@MYCDB1->PDBTEST01> alter tablespace TS_ON_FLASH add datafile '+FLASH_DG' size 30G ;

Tablespace altered.
Test with TEMP tablespace on disk
I took a random table from my test database, it happened to be one TESTUSER.TESTTAB01 with ~28GB. I just paid attention that it’d be large enough so that the HASH JOIN would spill to TEMP.
Then I made up a query which would hammer the TEMP tablespace, so I forced a hash join (where a.id = b.id) and the aggregation (max).
SQL> desc testuser.testtab01

Name                                                  Null?    Type
----------------------------------------------------- -------- ------------------------------------
ID                                                             NUMBER
BUSINESS_DATE                                                  DATE
AMOUNT01                                                       NUMBER
AMOUNT02                                                       NUMBER
AMOUNT03                                                       NUMBER
MODABS600                                                      NUMBER

SEGMENT_NAME                                                 SEGMENT_TYPE       TABLESPACE_NAME                      SEG_MB   LOBSIZE_MB     TOTAL_MB
------------------------------------------------------------ ------------------ ------------------------------ ------------ ------------ ------------
TESTUSER.TESTTAB01                                            TABLE              MYTS                                 28,564                    28,564
Then I executed the test query :
20:26:02 TESTUSER @ PDBTEST01>
select max(c.BUSINESS_DATE)
from
(
select a.* , b.AMOUNT01
from testuser.TESTTAB01 a, testuser.TESTTAB01 b
where a.id = b.id
) c ;


MAX(C.BUSINESS_DATE
-------------------
02-02-2023 10:40:54

Elapsed: 00:12:53.13
It jumped to TEMP immediately and at the peak used up ~26GB of TEMP.
The query needed 12 minutes and 53 seconds (773 seconds) to complete.
Now, finally there came the question: how to estimate the potential gain being the result of putting the TEMP on Flash.
Having the data from Active Session History is already a good starting point for profiling such execution and breaking it down to the wait events and the time spent on CPU.
Let’s express that in terms of the percentage, breaking it down to all involved factors the SQL was waiting for :
SQL_ID        EVENT                          min_wtime[us]    max_wtime[us] avg_wtime[us]              CNT cnt of all waits for given SQL % of all waits for sqlid [ % of all waits ]
------------- ------------------------------ ------------- ---------------- ------------- ---------------- ------------------------------ ------------------------ ------------------
09bmj7j9q8a5z ASM IO for non-blocking poll               4               20            15                5                            773                      .65                .65
09bmj7j9q8a5z direct path write temp                   187              656           446               12                            773                     1.55               1.55
09bmj7j9q8a5z (on CPU)                                   0                0             0              338                            773                    43.73              43.73
09bmj7j9q8a5z direct path read temp                  2,595          415,850        19,305              418                            773                    54.08              54.08
                                                                                          ----------------
sum                                                                                                    773
The script I have used :
-- Author: Piotr Sajda
-- The script profiles the waits and cpu time for a given SQL_ID and SQL_EXEC_ID and shows the percentage for each wait event
-- The parameters can be omitted (the script uses the nvl function to accomplish the filtering).


col "avg_wtime[us]" form 999,999
col "min_wtime[us]" form 999,999
col "max_wtime[us]" form 999,999,999,999

compute sum of CNT on report
break on report

select ash.sql_id,  nvl(event,'(on CPU)') event,
round(min(ash.time_waited),0) "min_wtime[us]" ,
round(max(ash.time_waited),0) "max_wtime[us]",
round(avg(ash.time_waited),0) "avg_wtime[us]",
count(*) cnt ,
sum(count(*)) over (partition by ash.sql_id) "cnt of all waits for given SQL" ,
round( count(*) / sum(count(*)) over (partition by ash.sql_id) * 100 , 2 ) "% of all waits for sqlid" ,
round( count(*)*100/(sum(count(*)) over ()) , 2) "[ % of all waits ]"
from gv$active_session_history ash
where
ash.sql_id = nvl('&&SQL_ID',ash.sql_id)
and to_char(SQL_EXEC_ID) = to_char( nvl('&&SQL_EXEC_ID',ash.SQL_EXEC_ID) )
and sample_time >= ( sysdate - to_number(  nvl('&How_Many_Minutes_Back',999999999)/24/60 ) )
and ash.sql_id is not NULL
and (event like nvl('&wait_event1',event) OR event like nvl('&wait_event2',event) or event is null)
group by ash.sql_id,  event
order by   "[ % of all waits ]"
/
Clearly, the time spent on TEMP constitutes roughly 56% of the entire elapsed time for that query (move to the very right of the above output).
The number can be withdrawn from the sum of duration of two wait events which are associated with the hash-join and the aggregation (54.08 + 1.55 [%]) :
- direct path read temp (54.08 %)
- direct path write temp (1.55 %)
So there is quite an improvement area.
First, let’s calculate the time which was spent on hash-join and the aggregation, so technically while accessing the TEMP tablespace.
773 [sec] * 0.56 [%] = 433 [sec]
So it’s 433 seconds out of 733 which we now are after to squeeze.
That would give the following ad-hoc formula of the expected elapsed time of the boosted query: 773 [sec] – 433 [sec] + N_flash [sec]
Now we need to estimate the N_flash summand.
You might be tempted to use the avg_wtime[us] from the above output (say, 19 milliseconds), which is understood as “avg I/O time of a single read from disk while accessing TEMP tablespace”) , then to apply the following calculation giving you the gain-factor (so, roughly speaking “this many times faster with flash”) :
( avg_wtime[us] ) / ( expected latency of I/O on Flash )
Note of caution
The “avg_wtime[us]” is calculated as follows : round(avg(ash.time_waited),0) and it comes from gv$active_session_history (see the script).
Unfortunately, time_waited from gv$active_session_history is subject to inaccuracy and it should rather be treated as the indicator to e.g. establish proportions, outliers, and the like – including the contributors percentage calculated above which btw. was extremely useful for my case.
Let’s reach out to Oracle DOC of v$active_session_history and specifically to the definition of TIME_WAITED which I used :
If SESSION_STATE = WAITING, then TIME_WAITED holds the time that the session actually spent waiting for that event (in microseconds).
This column is set for waits that were in progress at the time the sample was taken.
If you take into account that ASH samples an active session once a second you will come to the following conclusion – here I will quote it – “longer wait events, even if they happen infrequently, stand a higher chance of being sampled because of their longer duration”.
More details are here: https://forums.oracle.com/ords/apexds/post/active-session-history-elapse-time-calculation-8225 with quite an interesting discussion.
Let’s depict it.
Having an active session with SIDn here is the progress of its activity (from left to right).
The arrows are the ASH samples.
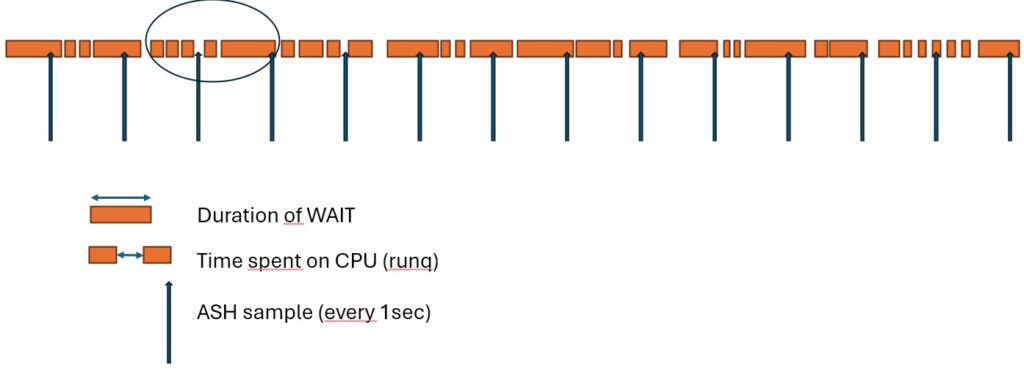
If we take the magnifying glass :
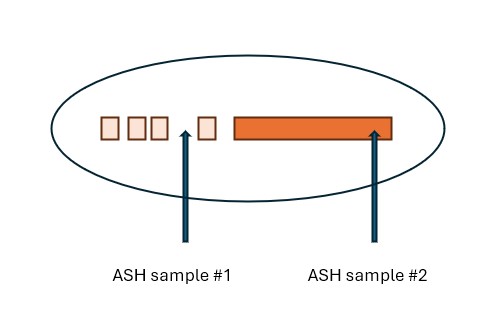
These two ASH samples for a given SID (SIDn) would report the following :
#1 sample: SIDn was on CPU (runq)
#2 sample: SIDn was in WAIT event whose duration is not really representative for the whole history of SIDn.
The ASH sampling “hit” that wait as statistically it had bigger chances to be hit since its duration is longer than the duration of the others.
In addition: the first 4 WAITS (much shorter) are completely missed, thus they won’t have any entries in the v$active_session_history, yet they obviously resulted in fetching the same amount of data (if it’s e.g. a single read of an index leaf block).
Now, it becomes obvious that the average value of the duration of all waits calculated based on these two samples would not reflect the reality.
Indeed, the average value of 19 ms of the latency from ASH depicts the excessive number and we will find out soon.
As a side comment though, provided you won’t be able to get more accurate values, this number gives you at least some notion.
In my case it turned out to be inflated x2.
Coming back to the main formula.
Having – what I called – the gaining-factor being the result of the division: ( “avg I/O time on disk” divided by “avg I/O disk on Flash” ), I am proceeding further.
Recall:
773 sec. is the total elapsed time
433 sec. is the time spent on TEMP on HDD
So first, what’s the gaining factor of a single wait event related to reading from TEMP if TEMP placed on flash disk group?
Since ASH won’t give us good enough values in this regard, we need to revert to more precise methods, like 10046 raw trace file is.
In order to get the required data from 10046 I have left the query running for the representative amount of time, so some short minutes, but awaiting the moment of HASH JOIN to commence), then I started the trace with 10046 (using SID and SERIAL# of my session) :
exec dbms_monitor.session_trace_enable(session_id=>&sid_to_trace,serial_num=>&serial_to_trace,binds=>true,waits=>true);
As a result, I got the raw 10046 trace file whose small excerpt looks this :
....
WAIT #140691456823824: nam='direct path read temp' ela= 13700 file number=203 first dba=2827236 block cnt=31 obj#=99574 tim=25786537823120
WAIT #140691456823824: nam='direct path read temp' ela= 1782 file number=203 first dba=2818276 block cnt=31 obj#=99574 tim=25786537827221
WAIT #140691456823824: nam='direct path read temp' ela= 1178 file number=203 first dba=2810181 block cnt=31 obj#=99574 tim=25786537830329
WAIT #140691456823824: nam='direct path read temp' ela= 6137 file number=203 first dba=2792005 block cnt=31 obj#=99574 tim=25786537840133
WAIT #140691456823824: nam='direct path read temp' ela= 11296 file number=203 first dba=2776071 block cnt=31 obj#=99574 tim=25786537855500
WAIT #140691456823824: nam='direct path read temp' ela= 6903 file number=203 first dba=2768740 block cnt=31 obj#=99574 tim=25786537864466
WAIT #140691456823824: nam='direct path read temp' ela= 9575 file number=203 first dba=2737221 block cnt=31 obj#=99574 tim=25786537881156
WAIT #140691456823824: nam='direct path read temp' ela= 12866 file number=203 first dba=2728548 block cnt=31 obj#=99574 tim=25786537895977
WAIT #140691456823824: nam='direct path read temp' ela= 7206 file number=203 first dba=2695877 block cnt=31 obj#=99574 tim=25786537910915
WAIT #140691456823824: nam='direct path read temp' ela= 4763 file number=203 first dba=2621990 block cnt=31 obj#=99574 tim=25786537930945
WAIT #140691456823824: nam='direct path read temp' ela= 19453 file number=203 first dba=2606436 block cnt=31 obj#=99574 tim=25786537954443
WAIT #140691456823824: nam='direct path read temp' ela= 7327 file number=203 first dba=2581220 block cnt=31 obj#=99574 tim=25786537967597
WAIT #140691456823824: nam='direct path read temp' ela= 5857 file number=203 first dba=2540997 block cnt=31 obj#=99574 tim=25786537983010
WAIT #140691456823824: nam='direct path read temp' ela= 6229 file number=203 first dba=2524132 block cnt=31 obj#=99574 tim=25786537993558
WAIT #140691456823824: nam='direct path read temp' ela= 8484 file number=203 first dba=2473735 block cnt=31 obj#=99574 tim=25786538014047
WAIT #140691456823824: nam='direct path read temp' ela= 12884 file number=203 first dba=2434567 block cnt=31 obj#=99574 tim=25786538038103
WAIT #140691456823824: nam='direct path read temp' ela= 10064 file number=203 first dba=2418086 block cnt=31 obj#=99574 tim=25786538053116
WAIT #140691456823824: nam='direct path read temp' ela= 16084 file number=203 first dba=2376711 block cnt=31 obj#=99574 tim=25786538081049
WAIT #140691456823824: nam='direct path read temp' ela= 6293 file number=203 first dba=2360071 block cnt=31 obj#=99574 tim=25786538092208
WAIT #140691456823824: nam='direct path read temp' ela= 5786 file number=203 first dba=2343140 block cnt=31 obj#=99574 tim=25786538103196
WAIT #140691456823824: nam='direct path read temp' ela= 8644 file number=203 first dba=2326919 block cnt=31 obj#=99574 tim=25786538115719
WAIT #140691456823824: nam='direct path read temp' ela= 7856 file number=203 first dba=2318630 block cnt=31 obj#=99574 tim=25786538125788
WAIT #140691456823824: nam='direct path read temp' ela= 2502 file number=203 first dba=2260902 block cnt=31 obj#=99574 tim=25786538141711
WAIT #140691456823824: nam='direct path read temp' ela= 5942 file number=203 first dba=2236039 block cnt=31 obj#=99574 tim=25786538154234
WAIT #140691456823824: nam='direct path read temp' ela= 6126 file number=203 first dba=2227463 block cnt=31 obj#=99574 tim=25786538162586
WAIT #140691456823824: nam='direct path read temp' ela= 5493 file number=203 first dba=2219814 block cnt=31 obj#=99574 tim=25786538170198
WAIT #140691456823824: nam='direct path read temp' ela= 9919 file number=203 first dba=2195556 block cnt=31 obj#=99574 tim=25786538186551
WAIT #140691456823824: nam='direct path read temp' ela= 12492 file number=203 first dba=2187077 block cnt=31 obj#=99574 tim=25786538201117
WAIT #140691456823824: nam='direct path read temp' ela= 3164 file number=203 first dba=2178439 block cnt=31 obj#=99574 tim=25786538206329
WAIT #140691456823824: nam='direct path read temp' ela= 9894 file number=203 first dba=2170375 block cnt=31 obj#=99574 tim=25786538218560
WAIT #140691456823824: nam='direct path read temp' ela= 10572 file number=203 first dba=2137479 block cnt=31 obj#=99574 tim=25786538237184
WAIT #140691456823824: nam='direct path read temp' ela= 1264 file number=203 first dba=2121700 block cnt=31 obj#=99574 tim=25786538242403
WAIT #140691456823824: nam='direct path read temp' ela= 6007 file number=203 first dba=2105254 block cnt=31 obj#=99574 tim=25786538252193
....
The content of the 10046 raw trace file is a gold mine (also – or in particular – before being processed by tkprof).
There are numerous good articles explaining the content of the raw 10046 file, for us it’s sufficient to state one fact though :
An entry with the preceding WAIT string reports the completed wait expressed in microseconds (section “ela= xxxxx”).
So, for example the first marked line provides us the length of the completed I/O wait ‘direct path read temp’ which in this case took 13700 microseconds, so 13.7 ms (rather long, btw).
WAIT #140691456823824: nam=’direct path read temp’ ela= 13700 file number=203 first dba=2827236 block cnt=31 obj#=99574 tim=25786537823120
So far so good and.. a lot of data.
Now, if I use tkprof on top of the raw 10046 trace file I will also get the average number with the simple division of “Total Waited” (in seconds!) divided by – as it’s called “Times”, so number of occurrences (so, it happened this many “times”).
Elapsed times include waiting on following events:

  Event waited on                             Times   Max. Wait  Total Waited
  —————————————-   Waited  ———-  ————
  direct path write temp                       3087        0.02         13.30
  direct path read temp                       12764        0.32        114.80
But let’s play with the raw 10046 trace file.
I have written a simple shell script which calculates the averages along with some other useful data with the raw 10046 trace file as the input. Here are the results :
run10046.sh MYCDB1_ora_136430.trc


****** REPORT :
total for waits [msec]: 118472


****** DETAILS :

------------------------------------------------------------------------------------------------------------------------------------------------------------
ASM file metadata operation                            took :       0.1  [ms],      0.00 [%],  occured:            1  times, average[MicroSec] :     70
ASM IO for non-blocking poll                           took :    1279.3  [ms],      1.08 [%],  occured:        50300  times, average[MicroSec] :     25
cell smart table scan                                  took :    1473.1  [ms],      1.24 [%],  occured:         4196  times, average[MicroSec] :    351
direct path read temp                                  took :  114867.3  [ms],     96.96 [%],  occured:        12764  times, average[MicroSec] :   8999
direct path write temp                                 took :     853.3  [ms],      0.72 [%],  occured:         3087  times, average[MicroSec] :    276
enq: KO - fast object checkpoint                       took :       0.8  [ms],      0.00 [%],  occured:            2  times, average[MicroSec] :    380
KSV master wait                                        took :     147.8  [ms],      0.12 [%],  occured:            2  times, average[MicroSec] :  73920
oracle thread bootstrap                                took :      44.2  [ms],      0.04 [%],  occured:            1  times, average[MicroSec] :  44216
PGA memory operation                                   took :       0.1  [ms],      0.00 [%],  occured:            9  times, average[MicroSec] :     14
reliable message                                       took :       3.0  [ms],      0.00 [%],  occured:            1  times, average[MicroSec] :   3025
The script run10046.sh is here :
#!/bin/bash

### Author: Piotr Sajda PS5
### profiling of 10046 raw trace file. Note, SQL*Net message waits are skipped. So is the CPU factoring.
### exec: ./run10046.sh <raw10064 trace file>. Example: ./run10046.sh TEST1_ora_24871.trc


if [ "x${1}" = "x" ]; then
  printf "\n"
  echo "give parameter which is the output file of 10046 trace, e.g. ./run10046.sh ora_SID_12345.trc"
  printf "\n"
  exit 0;
fi

MYTEMPFILE=/tmp/myfile$$
TRACEFILE=$1


cat $TRACEFILE | grep ^WAIT | grep -v 'SQL\*Net message' | awk -F \'  '{print $2}' | sort | uniq > $MYTEMPFILE

printf "\n%-50s\n"
printf "\n%-50s\n"

echo "****** REPORT :"

mytotal=$(cat $TRACEFILE  | grep ^WAIT |   grep -v 'SQL\*Net message' | awk -F \'  '{print $3}' | awk '{count++} {mysum += $2} END { print mysum/1000 }')
echo "total for waits [msec]: $mytotal"

printf "\n%-50s\n"
echo "****** DETAILS :"


printf "\n%-70s\n" "------------------------------------------------------------------------------------------------------------------------------------------------------------"
while read mywait
do

printf "%-50s %10s" "$mywait" " took :"
cat $TRACEFILE  | grep ^WAIT |  fgrep "$mywait"  | awk -F \'  '{print $3}' | awk  -v awktotal=$mytotal '{count++} {mysum += $2}
     END { printf("%10.1f  %-8s  %5.2f %-5s %-3s  %10i %-8s %5.0f\n", mysum/1000 , "[ms],", (mysum/1000)/awktotal*100, "[%],", "occured: ", count , " times, average[MicroSec] : ", mysum/count) }'

done  < $MYTEMPFILE

printf "\n"

rm $MYTEMPFILE
I deliberately started 10046 tracing at the moment the SQL was in the phase of HASH-JOIN, so that I could hit the “direct path read temp” in the largest possible extent.
That explains the overall percentage of 96.96% across all other waits. In reality – see above – that part constituted ~56 %.
Considering that my goal was to calculate the average latency of direct path read temp with TEMP on disk I can ignore the rest of data and will simply use 8999 microseconds as the number for the subsequent calculations.
Ok, now that I have the average latency of an I/O while reading from TEMP on disk, I still need the other part, namely the latency of an I/O while reading from TEMP on flash.
Well, there are certainly some credible data to be found when googling, I had a luxury to test it live as I prepared an ASM disk group placed on flash with a TEMP tablespace there (I gave it a name TEMP_ON_FLASH).
Test with TEMP tablespace on Flash
So, as simple as that, I repeated the test from above, this time with the TEMP on flash disks :
SYS@MYCDB1->PDBTEST01> alter user testuser temporary tablespace TEMP_ON_FLASH ;

User altered.
Then I executed the query, awaiting till it hit the HASH-JOIN and then I have started 10046 tracing, keeping it for some dozen of seconds.
The representative excerpt of the raw 10046 trace file looks like this :
....
WAIT #139945425250720: nam='direct path read temp' ela= 154 file number=208 first dba=62863 block cnt=15 obj#=99574 tim=25788421586637
WAIT #139945425250720: nam='direct path read temp' ela= 114 file number=210 first dba=63841 block cnt=15 obj#=99574 tim=25788421587261
WAIT #139945425250720: nam='direct path read temp' ela= 57 file number=212 first dba=64384 block cnt=15 obj#=99574 tim=25788421587799
WAIT #139945425250720: nam='direct path read temp' ela= 166 file number=205 first dba=65287 block cnt=15 obj#=99574 tim=25788421588477
WAIT #139945425250720: nam='direct path read temp' ela= 59 file number=206 first dba=65920 block cnt=15 obj#=99574 tim=25788421589013
WAIT #139945425250720: nam='direct path read temp' ela= 152 file number=209 first dba=66989 block cnt=15 obj#=99574 tim=25788421589616
WAIT #139945425250720: nam='direct path read temp' ela= 115 file number=205 first dba=67757 block cnt=15 obj#=99574 tim=25788421590217
WAIT #139945425250720: nam='direct path read temp' ela= 105 file number=207 first dba=68480 block cnt=15 obj#=99574 tim=25788421590818
WAIT #139945425250720: nam='direct path read temp' ela= 171 file number=206 first dba=70332 block cnt=15 obj#=99574 tim=25788421592096
WAIT #139945425250720: nam='direct path read temp' ela= 157 file number=208 first dba=71446 block cnt=15 obj#=99574 tim=25788421592731
WAIT #139945425250720: nam='direct path read temp' ela= 83 file number=209 first dba=72064 block cnt=15 obj#=99574 tim=25788421593360
WAIT #139945425250720: nam='direct path read temp' ela= 177 file number=210 first dba=73057 block cnt=15 obj#=99574 tim=25788421593999
WAIT #139945425250720: nam='direct path read temp' ela= 138 file number=206 first dba=73840 block cnt=15 obj#=99574 tim=25788421594630
WAIT #139945425250720: nam='direct path read temp' ela= 71 file number=212 first dba=74864 block cnt=15 obj#=99574 tim=25788421595218
WAIT #139945425250720: nam='direct path read temp' ela= 153 file number=207 first dba=75497 block cnt=15 obj#=99574 tim=25788421595819
WAIT #139945425250720: nam='direct path read temp' ela= 60 file number=207 first dba=76325 block cnt=15 obj#=99574 tim=25788421596383
WAIT #139945425250720: nam='direct path read temp' ela= 54 file number=209 first dba=77199 block cnt=15 obj#=99574 tim=25788421596899
WAIT #139945425250720: nam='direct path read temp' ela= 54 file number=212 first dba=77982 block cnt=15 obj#=99574 tim=25788421597486
WAIT #139945425250720: nam='direct path read temp' ela= 161 file number=204 first dba=78720 block cnt=15 obj#=99574 tim=25788421598099
....
Clearly, the elapsed time for a single I/O while reading from TEMP placed on flash dropped dramatically – see all the “ela’s” above – now they are within the boundary of low hundreds of microseconds, so 154, 114, etc.
Let’s have a clear picture though and let’s process the raw 10046 trace file with the shell script (my simple profiler) from above :
[oracle @ MYCDB1 @ testhost01 ]$ # ./run10046.sh /u01/app/oracle/diag/rdbms/MYCDB/MYCDB1/trace/MYCDB1_ora_60339.trc


****** REPORT :
total for waits [msec]: 11292.6


****** DETAILS :

------------------------------------------------------------------------------------------------------------------------------------------------------------
ASM IO for non-blocking poll                           took :    1789.1  [ms],     15.84 [%],  occured:        98201  times, average[MicroSec] :     18
cell smart table scan                                  took :    1136.7  [ms],     10.07 [%],  occured:         1126  times, average[MicroSec] :   1009
direct path read temp                                  took :    3557.8  [ms],     31.51 [%],  occured:        23647  times, average[MicroSec] :    150
latch: cache buffers chains                            took :       0.0  [ms],      0.00 [%],  occured:            1  times, average[MicroSec] :      2
local write wait                                       took :    4808.9  [ms],     42.58 [%],  occured:        11547  times, average[MicroSec] :    416
PGA memory operation                                   took :       0.1  [ms],      0.00 [%],  occured:            1  times, average[MicroSec] :    101
Ah, so now we talk in the range of 150 microseconds on average.
Side note again.
Are these both numbers (8999 microsec. latency if accessing HDD and 150 microsec. for flash) any surprise?
Obviously not.
You might ask – so why bothering and not simply take the usual values of the corresponding latency from the documentation sheets for an average latency while reading from a spindle and flash card, and just carry on with the reconfiguration.
Recall, I was to tackle huge amount of terabytes and the assumption of the usually assumed dispersion of an average I/O of 2-10 ms for HDD and for flash of some 100-400 microseconds may ring the bell.
What I am aiming to, each single miscalculated range of milliseconds (so, should I rather take the number closer to 2ms or 10ms?) and each falsely estimated 100 of microsec. for flash would possibly result in additional weeks of data processing.
Secondly, these assumptions (2-10ms) are assumed for “healthy” working environment, under usual conditions- so assumed is: no anomalies.
Having that in mind, what for example if it had turned out that the actual latency of I/O to disk would have been somewhere around 15ms+ ?
On one hand “great” – the bigger benefit of placing the TEMP on flash. Good.. but there’s still the other side of coin – what if for any reason the flash wouldn’t respond as expected?
So, back to math.
Let’s calculate how much can we gain from placing the TEMP on flash as follows :8999/150 = 59.99
So, it’s expected that a single direct path read temp with TEMP tablespace on flash disks should be 59.99 times faster.
If so, let’s divide the elapsed time spent on reading/writing (predominantly reading) from TEMP located on HDD (433 sec) by that factor (59.99) :433/59.99 = 7.217 [sec]
So, for better understanding of the above calculation:
because the time lost on reading from TEMP tablespace from flash disks should be ~60 times shorter, I have divided this isolated time component of 433 seconds (time spent on accessing the TEMP tablespace on HDD) by 59.99. As a result I got: 7.21 seconds.
With that in mind let’s make the final correction :
773 (total sec.) – 433 (time spent with TEMP on HDD in sec.) + 7.21 (time spent on TEMP on Flash in sec. – just calculated) = 347.21 [seconds] which is the final expected value.
So my magic number is 347 seconds as the expected total duration of that query with
It’s important to note that this is still a theoretical value, based on isolating the “TEMP on HDD” component, which accounted for approximately 56% of the total execution time of the test query, and then applying a ~60% “boost factor” specifically to that component.
Let’s fully run the SQL as the final test, this time with TEMP on Flash Disks:
20:57:10 TESTUSER @ PDBTEST01>
select max(c.BUSINESS_DATE)
from
(
select a.* , b.AMOUNT01 from testuser.TESTTAB01 a, testuser.TESTTAB01 b
where a.id = b.id
) c ;

MAX(C.BUSINESS_DATE
-------------------
02-02-2023 10:40:54

Elapsed: 00:05:48.83
Indeed, the math was fairly close: 5 mins and 48 seconds which makes 348 seconds against calculated 347 seconds (accuracy 99.7% = 347/348 * 100%).
Is it good enough?
For my purpose – it was. The real query from the production database revealed very similar gain based on the calculations accomplished the way presented above.
At least it wasn’t miscalculated by the order of magnitude 😉
Update 14.10.2024 :
Some months later, while preparing for my presentation for POUG I executed similar test on much newer version of Exadata (ver. X9 I believe) and observed something which was a nice surprise.
Namely, I stated that even though my TEMP tablespace resided on regular HDD the latency of “direct path write/read temp” was fairly low (~200 microseconds).
That baffled me and astonished at the same time since such low latency is unachievable while writing to the regular HDD (spindle).
I put the description related to this below.
The below pseudo-code for HASH-JOIN : (copied from here)
// Build phase
FOR each row in BuildTable DO
    Compute hash value for the join key
    Insert row into HashTable based on hash value (write I/O to TEMP)
END FOR

// Probe phase
FOR each row in ProbeTable DO
    Compute hash value for the join key
    IF hash value exists in HashTable THEN
        Retrieve matching rows from HashTable   (read I/O from TEMP)
        FOR each matching row DO
            Combine rows from ProbeTable and BuildTable
            Add the combined row to the result set
        END FOR
    END IF
END FOR
Tracing the selected statistics while building of HashTable :
STATISTIC NAME                                                                     VALUE     VALUE per sec              VALUE accumulated
cell flash cache read hits                                                           983               327                        365,064
cell flash cache read hits for smart IO                                              983               327                        155,505
cell flash cache read hits for temp IO                                                 0                 0                        209,425
cell num smartio automem buffer allocation attempts                                    0                 0                              6
cell overwrites in flash cache                                                         0                 0                            280
cell physical IO bytes eligible for predicate offload                        867,524,608       289,174,869                128,195,682,304
cell physical IO bytes eligible for smart IOs                                867,524,608       289,174,869                128,195,682,304
cell physical IO interconnect bytes                                          804,679,040       268,226,346                200,687,062,608
cell physical IO interconnect bytes returned by smart scan                   164,212,096        54,737,365                 35,602,214,480
cell writes to flash cache                                                         2,522               840                        446,110
cell writes to flash cache for temp IO                                             2,522               840                        446,110
physical read IO requests                                                            983               327                        365,064
physical read bytes                                                          867,524,608       289,174,869                181,376,581,632
physical read requests optimized                                                     983               327                        365,064
physical read total IO requests                                                      983               327                        365,064
physical read total bytes                                                    867,524,608       289,174,869                181,376,581,632
physical read total bytes optimized                                          867,524,608       289,174,869                181,376,581,632
physical read total multi block requests                                             964               321                        360,130
physical reads                                                                   105,899            35,299                     22,140,696
physical reads cache                                                                   0                 0                            161
physical reads cache prefetch                                                          0                 0                             10
physical reads direct                                                            105,899            35,299                     22,140,535
physical reads direct temporary tablespace                                             0                 0                      6,491,648
physical write IO requests                                                         1,261               420                        220,326
physical write bytes                                                         320,233,472       106,744,490                 55,952,228,352
physical write total IO requests                                                   1,261               420                        220,325
physical write total bytes                                                   320,233,472       106,744,490                 55,951,974,400
physical write total bytes optimized                                         320,233,472       106,744,490                 55,951,974,400
physical write total multi block requests                                          1,261               420                        220,325
physical writes                                                                   39,091            13,030                      6,830,106
physical writes direct                                                            39,091            13,030                      6,830,106
physical writes direct temporary tablespace                                       39,091            13,030                      6,830,106
physical writes non checkpoint                                                    39,091            13,030                      6,830,106
temp space allocated (bytes)                                                 330,301,440       110,100,480                  1,508,900,864
Tracing the selected statistics while probing the ProbeTable :
STATISTIC NAME                                                                     VALUE     VALUE per sec              VALUE accumulated
cell flash cache read hits                                                         1,796               598                        437,439
cell flash cache read hits for smart IO                                                0                 0                        223,608
cell flash cache read hits for temp IO                                             1,796               598                        213,697
cell num smartio automem buffer allocation attempts                                    0                 0                              7
cell overwrites in flash cache                                                         0                 0                            428
cell physical IO bytes eligible for predicate offload                                  0                 0                183,728,758,784
cell physical IO bytes eligible for smart IOs                                          0                 0                183,728,758,784
cell physical IO interconnect bytes                                          456,097,792       152,032,597                268,334,956,952
cell physical IO interconnect bytes returned by smart scan                             0                 0                 51,781,403,032
cell writes to flash cache                                                             0                 0                        647,240
cell writes to flash cache for temp IO                                                 0                 0                        647,240
physical read IO requests                                                          1,796               598                        437,439
physical read bytes                                                          456,097,792       152,032,597                237,994,541,056
physical read requests optimized                                                   1,796               598                        437,438
physical read total IO requests                                                    1,796               598                        437,438
physical read total bytes                                                    456,097,792       152,032,597                237,994,287,104
physical read total bytes optimized                                          456,097,792       152,032,597                237,994,287,104
physical read total multi block requests                                           1,796               598                        430,300
physical reads                                                                    55,676            18,558                     29,052,068
physical reads cache                                                                   0                 0                            161
physical reads cache prefetch                                                          0                 0                             10
physical reads direct                                                             55,676            18,558                     29,051,907
physical reads direct temporary tablespace                                        55,676            18,558                      6,624,080
physical write IO requests                                                             0                 0                        319,525
physical write bytes                                                                   0                 0                 81,144,012,800
physical write total IO requests                                                       0                 0                        319,525
physical write total bytes                                                             0                 0                 81,144,012,800
physical write total bytes optimized                                                   0                 0                 81,144,012,800
physical write total multi block requests                                              0                 0                        319,525
physical writes                                                                        0                 0                      9,905,275
physical writes direct                                                                 0                 0                      9,905,275
physical writes direct temporary tablespace                                            0                 0                      9,905,275
physical writes non checkpoint                                                         0                 0                      9,905,275
temp space allocated (bytes)                                                           0                 0                 27,447,525,376
The look from a different angle.
I logged in to one of the cells and – while the query processing reached the phase of building of the HashTable – I have executed the “iostat -x” and stated the following :
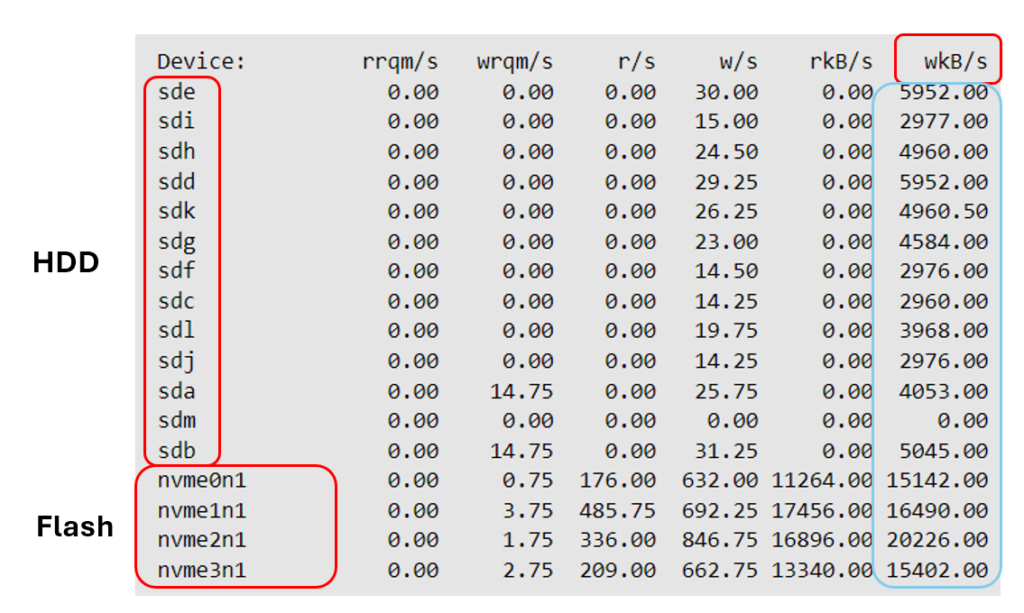
Clearly, the nvm’s (devices which represent the FlashCards on a cell) reported write operations. I need you to keep in mind that I executed a SELECT statement, so such write I/Os could only be initiated by the phase of creating of the HashTable (so, this phase would essentially be associated with writing to TEMP tablespace – wherever it’d be located).
Yet on Exadata they definitely hit the Flash Disks.
Side note: to be accurate, another such circumstance (writing on disk while running a SELECT statement) could be associated with “enq: KO – fast object checkpoint” – but that would last much shorter – nicely explained here.
The iostat has been running in sync with my script which reported the non-zero values of “cell writes to flash cache for temp IO“. In addition, if you take a look at another statistic: “cell writes to flash cache“, it shows the same value per sec: 840.
That means, all the writes to flash cache were performed on behalf of creating of the HashTable.
Short note: admittedly, I was not alone on this system, but the system was almost idle and most importantly, I have been running the same (short) scenario over and over again, several times.
Each time I could notice a burst of writing to flash on behalf of temp IO which was in perfect sync with the phase (and beginning) of creating of the HashTable.
In another session I kept my script running which probed the selected statistics (see above) with 3 seconds sampling gap.
I was monitoring both sessions simultaneously.
That virtually leaves no doubts that (on the newer versions of Exadata) the HashTable will be (attempted to be) put in Flash Memory and this is why I have observed such low latency for “direct path read/write temp”, even though my regular TEMP tablespace was located on HDD.
I am not certain whether this happens on a “best effort” basis (e.g. there is some space limit for such HashTable in Flash and/or table/index/MV segments may have higher priority and won’t be flushed at the cost of such HashTable).
Anyway, In my case the “cell overwrites in flash cache” was 0, which – as far as I understand the name of this statistics properly – would suggests that at the last the latter didn’t take place.
To further support this, upon the end of my presentation I had a chat with some Exadata experts specializing in internals of that appliance and they did confirm that – yes, the temp memory chunks (e.g. HashTable) are allowed to utilize the Flash Cache.
Well, the Exadata often leaves me speechless. It’s truly amazing appliance with plenty of optimizations of which I even have no clue they exist and may kick in silently.
I am not trying to state it’s always perfect (e.g. see my 3 part-series of “Lack of offload with large SGA“), yet it undoubtedly solves many potential performance issues which couldn’t possibly be properly handled elsewhere.
Leave a Reply